Home
Lap Timers
Screenshots
Tutorials/Race Formats
System Requirements
Download
Scorpius Wireless
Race Coordinator Digital
Drag Race Coordinator
FAQ
RC Charity
Contact
Screenshots
|
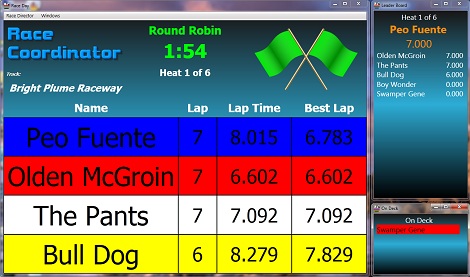
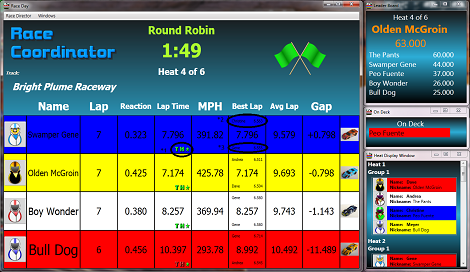
The default race screen with the leader board and on deck windows open. This screen contains enough information for a four lane track and has the bear
minimum information a driver would want to see as they are racing in a heat. Notice that the lanes are not in red, white, blue, yellow order.
They have sorted based on the drivers heat positions. Don't like the sorting? Race Coordinator comes with a skinned screen that doesn't sort them as well.
|
|
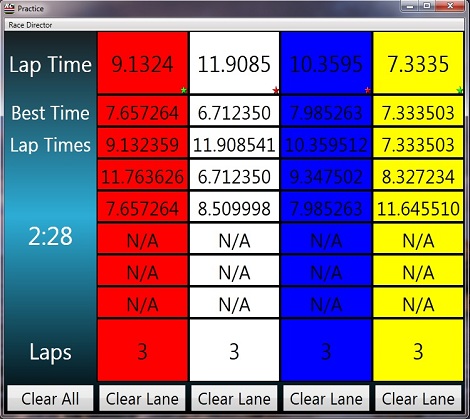
Another race screen typically used for practice races. This one allows the Race Director to clear lane data as drivers come and go off the lanes.
|
|
|
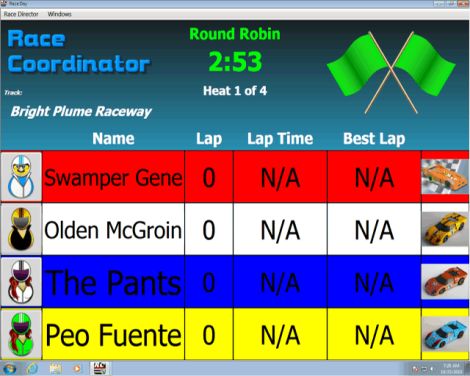
Yet another version of the race screen provided upon install. This one contains more information than the first including a driver image and car image.
Both of which can be changed to other images provided by the install or images provided by the user.
|
|
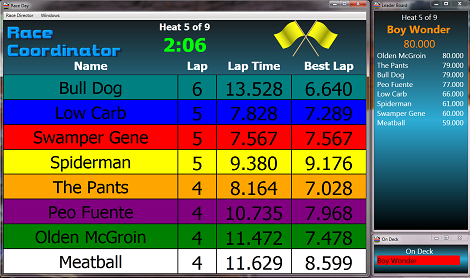
Here is an 8 lane race day screen provided upon install. This one has some of the top banner trimmed out to make as much space for the race data as possible.
|
|
|
This screen capture shows virtually every stat Race Coordinator can display during a race. It displays most of the vital data
in individual columns, but also illustrates that you can organize more than one piece of data within a column.
The MPH field stands for miles per hour and requires the track lanes specify their running length and the scale cars being run.
Kilometers per hour and feet per second (KPH and FPS) are also available for display.
Gap indicates the approximate time difference between the driver and the leader of the heat. If the two drivers are not on the same
lap this value is an estimate assuming the chase driver completes the laps behind in the same time the leader finished them in. This
value can also be expressed as the time difference between the driver and the next driver ahead of them as opposed to the leader of
of the race.
The following notes are circled on the image:
- The T performance symbol illustrates how the drivers last lap compares to the average lap time of the best race every run
on the 'T'rack. The H performance symbol illustrates how the drivers last lap compares to the average lap of the current
heat leader. And the * performance symbol illustrates how the drivers last lap compares to their own personal average lap
for the race. Green indicates a better lap, red indicates a worse lap. These performance images can be configured in the
race setup.
- The top name/time pair indicates the drivers name and lap time for the best lap on the specific lane for the current race
- The bottom name/time pair indicates the drivers name and lap time for the record lap on the specific lane across every
race run. If the top and bottom pair are the same as they are for the white lane, it indicates that the record lap was
set in the currently running race.
|
|
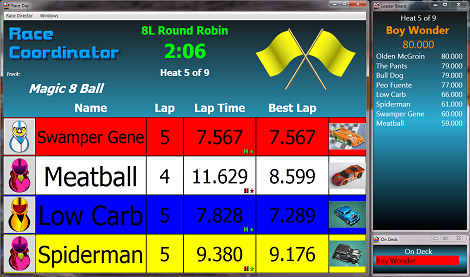
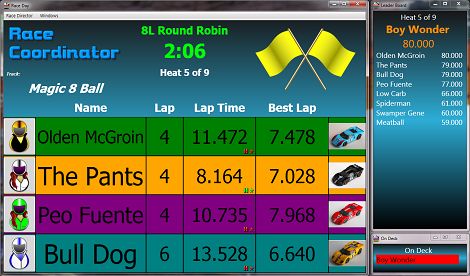
Race Coordinator can take advantage of as many displays as you have. This screen shot shows the eight lane race window
broken down into two different race windows. These xaml files use the static lane sorting so the drivers are not sorted
by heat position, but by the lane they are in. The left image shows the first four lanes (red, white, blue and yellow)
and the right image shows the other four lanes. Because there are now only four drivers in each window, the standard
four lane data and sizes are used.
The intent is to display one of these windows on one display and the other window on a secondary display. Two leader
board and on deck windows are also meant one for each display. Keep in mind that you can display as many
windows as you want and the same window can be opened as many times as desired. When taking these screen shots the
8 lane Race Day window was also open.
|
|



Race Coordinator Copyright (C) 2010-2012 DPASoft
